
Configure Apache Kylin with ODBC to work with MS PowerBI
PowerBI and Kylin - reporting from Hadoop via ODBC This article discusses how to setup an …
PowerBI and Kylin - reporting from Hadoop via ODBC This article discusses how to setup an …

Tableau Desktop supports visual analysis and data discovery, converts the raw information …
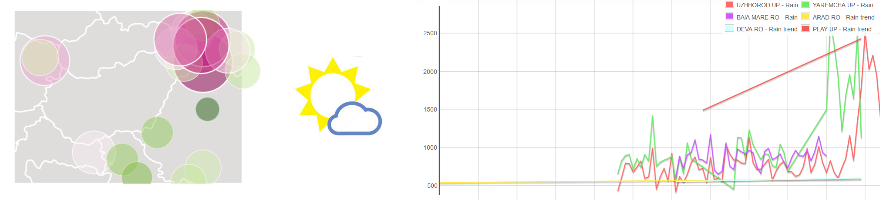
Tutorial big data analysis: Weather changes in the Carpathian-Basin from 1900 to 2014 - …

Tutorial big data analysis: Weather changes in the Carpathian-Basin from 1900 to 2014 - …

Tutorial big data analysis: Weather changes in the Carpathian-Basin from 1900 to 2014 - …

Tutorial big data analysis: Weather changes in the Carpathian-Basin from 1900 to 2014 - …

Tutorial big data analysis: Weather changes in the Carpathian-Basin from 1900 to 2014 - …

Tutorial big data analysis: Weather changes in the Carpathian-Basin from 1900 to 2014 - …

Tutorial big data analysis: Weather changes in the Carpathian-Basin from 1900 to 2014 - …

Tutorial big data analysis: Weather changes in the Carpathian-Basin from 1900 to 2014 - …

Tutorial big data analysis: Weather changes in the Carpathian-Basin from 1900 to 2014 - …
© 2026 Dataprd.Com